The Purpose
Why create a web app at all? Well, our team has an excellent database of brown dwarf objects. The various team members use our custom built package, astrodbkit, to explore the database in python and get the data they need. I figured it would be a lot easier, and more user-friendly, if a website was created that would allow users to get the information that they needed while running astrodbkit on the background. Thus started my adventure in creating AstrodbWeb. I should point out that the source code is all available at my Github repository.
Flask
The first step in deciding how to go about this was to figure out where to even start. At a local meeting of astronomers who discuss coding in New York (#AstroHackNY), one of them mentioned they had an application they had developed with the flask package for python. I had heard of flask before, when I applied to a Data Science internship (that I unfortunately didn't get to), so I figured that was a good place to start.
Flask is a framework to create web applications with python. You set up your environment and working directory, having things like static and template directories to host your CSS and HTML files and run a python script that activates the server. You have decorators on your python functions that tell the server what to do when a user navigates to a particular version of the site. For example, if a user goes to http://database.bdnyc.org/schema, my code will run the function bdnyc_schema() which will generate the page from the template HTML and static CSS files and the instructions in the function (in this case, a set of SQL commands). While flask has an official tutorial, I recommend starting with this one as it's easier to follow.
DataTables
One of the things that I needed to do was output the results of user-supplied SQL queries. Fortunately, astrodbkit does most of the work, but that returns a python structure, either a numpy array, a list of dictionaries, or an astropy Table. I ended up using the to_pandas() functionality of astropy Tables to convert the output to a pandas dataframe, which then allowed me to use to_html() to get an HTML formatted table.
However, base HTML tables are ugly. You can style them with CSS to make them look better, but I wanted far more functionality. Turns out that around the same time as I was working with this, I was learning about Shiny applications in R and their gallery has some nice-looking tables. I dug a little bit into that and found out that these are javascript-generated. In particular, I learned that these use the DataTables plugin for the jQuery javascript library. It was fairly easy to get the tables formatted as DataTables by adding some specific javascript commands to the template HTML files. Making them look even nicer took some edits to the static CSS file.
Bokeh
Our database also contains some spectroscopy that's been gathered by the various telescopes and instruments. I decided it would be excellent to dynamically plot the spectrum right in your browser so you could inspect it. For this, I needed a way to generate plots right to HTML rather than have to save them to a file and load them up. Enter: Bokeh. I had heard about Bokeh before, but never had a chance to try it. It's a plotting package in Python (though I recently learned it's also for Julia, Scala, and R) that is designed for web-based plots and offers lots of interactivity. Exploring a bit into it quickly had me generating a spectrum that the user could pan, zoom, and resize at will. I'll certainly be trying out more Bokeh plots in the future!
Heroku
So, I had a working application on my computer that could dynamically explore the database contents, however, I didn't want to drag my laptop to our group meetings each week. I needed a way to showcase the application as it was being developed and do so from any computer or mobile device. Well, there's a solution to that: hosting on a server. We have our own server, but I didn't want to use that until the application was ready, so I turned to Heroku. Heroku offers a way to host applications without having to have your own server and all the complexities that involves. I'm using the free version, which allows me to have applications up for 16 hours per day with some limited processing power. Not ideal for large projects, but certainly good enough for my purposes. While Heroku has extensive instructions, my application was simple enough to go live with a simple Procfile with the line "web: python runapp.py"
Finishing Touches
To transfer it to our server, I relied on our server administrator to take care of some of the final details. We basically followed the instructions outlined here. Setting up the virtual environment was easy enough for me to do, but there were some missing libraries and extra settings required that I had no access to or expertise in. Still, in the end we got it to work and the application is now live at http://database.bdnyc.org
Overall, it was a great learning experience and I hope to develop a few more applications both for the team and for my own personal projects!
Flask
The first step in deciding how to go about this was to figure out where to even start. At a local meeting of astronomers who discuss coding in New York (#AstroHackNY), one of them mentioned they had an application they had developed with the flask package for python. I had heard of flask before, when I applied to a Data Science internship (that I unfortunately didn't get to), so I figured that was a good place to start.
Flask is a framework to create web applications with python. You set up your environment and working directory, having things like static and template directories to host your CSS and HTML files and run a python script that activates the server. You have decorators on your python functions that tell the server what to do when a user navigates to a particular version of the site. For example, if a user goes to http://database.bdnyc.org/schema, my code will run the function bdnyc_schema() which will generate the page from the template HTML and static CSS files and the instructions in the function (in this case, a set of SQL commands). While flask has an official tutorial, I recommend starting with this one as it's easier to follow.
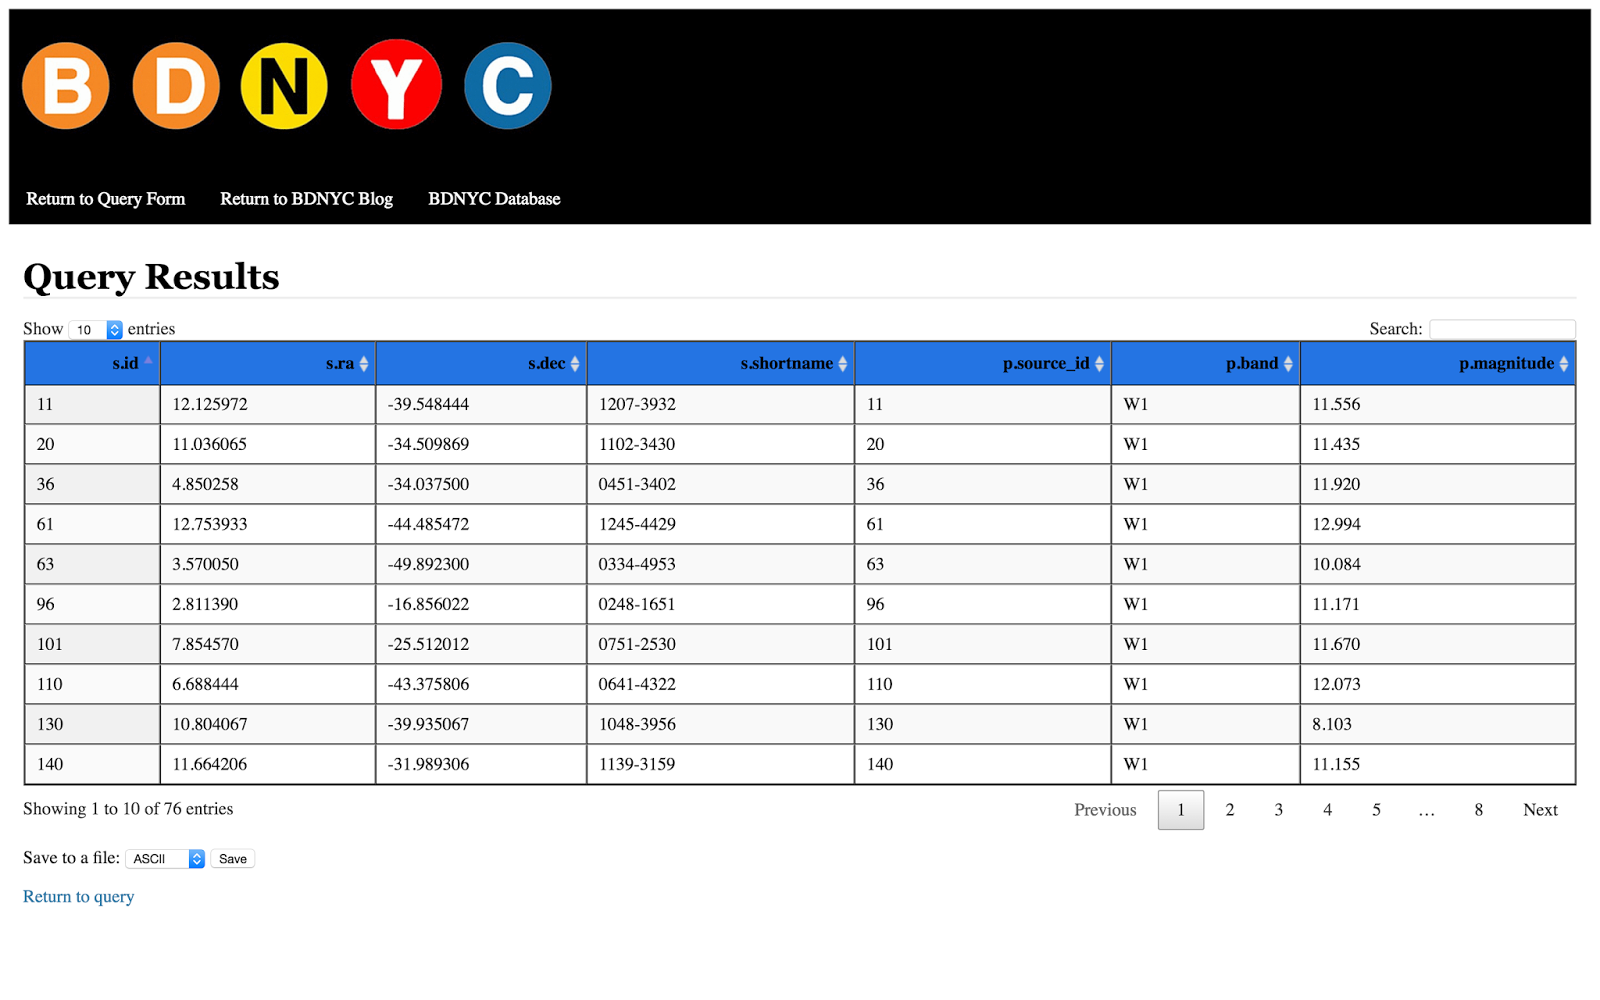 |
| Output results from an SQL query, formatted as a DataTable |
DataTables
One of the things that I needed to do was output the results of user-supplied SQL queries. Fortunately, astrodbkit does most of the work, but that returns a python structure, either a numpy array, a list of dictionaries, or an astropy Table. I ended up using the to_pandas() functionality of astropy Tables to convert the output to a pandas dataframe, which then allowed me to use to_html() to get an HTML formatted table.
However, base HTML tables are ugly. You can style them with CSS to make them look better, but I wanted far more functionality. Turns out that around the same time as I was working with this, I was learning about Shiny applications in R and their gallery has some nice-looking tables. I dug a little bit into that and found out that these are javascript-generated. In particular, I learned that these use the DataTables plugin for the jQuery javascript library. It was fairly easy to get the tables formatted as DataTables by adding some specific javascript commands to the template HTML files. Making them look even nicer took some edits to the static CSS file.
Bokeh
Our database also contains some spectroscopy that's been gathered by the various telescopes and instruments. I decided it would be excellent to dynamically plot the spectrum right in your browser so you could inspect it. For this, I needed a way to generate plots right to HTML rather than have to save them to a file and load them up. Enter: Bokeh. I had heard about Bokeh before, but never had a chance to try it. It's a plotting package in Python (though I recently learned it's also for Julia, Scala, and R) that is designed for web-based plots and offers lots of interactivity. Exploring a bit into it quickly had me generating a spectrum that the user could pan, zoom, and resize at will. I'll certainly be trying out more Bokeh plots in the future!
 |
| Bokeh figure of a spectrum for a particular source |
Heroku
So, I had a working application on my computer that could dynamically explore the database contents, however, I didn't want to drag my laptop to our group meetings each week. I needed a way to showcase the application as it was being developed and do so from any computer or mobile device. Well, there's a solution to that: hosting on a server. We have our own server, but I didn't want to use that until the application was ready, so I turned to Heroku. Heroku offers a way to host applications without having to have your own server and all the complexities that involves. I'm using the free version, which allows me to have applications up for 16 hours per day with some limited processing power. Not ideal for large projects, but certainly good enough for my purposes. While Heroku has extensive instructions, my application was simple enough to go live with a simple Procfile with the line "web: python runapp.py"
Finishing Touches
To transfer it to our server, I relied on our server administrator to take care of some of the final details. We basically followed the instructions outlined here. Setting up the virtual environment was easy enough for me to do, but there were some missing libraries and extra settings required that I had no access to or expertise in. Still, in the end we got it to work and the application is now live at http://database.bdnyc.org
Overall, it was a great learning experience and I hope to develop a few more applications both for the team and for my own personal projects!
No comments:
Post a Comment
Note: Only a member of this blog may post a comment.