Over the past few weeks, I've been taking an online course on Data Science with the R programing language. It's my first time taking an online course and it's been quite fun. I wanted to learn more about data science in general and this course came recommended by a friend. I didn't know anything about R at the start, but I have many years of experience working with Python, IDL, IRAF, etc, so it was easy to pick up. One of the best ways I learn, however, is through practice. So I figured I would create my own personal project: some data analysis on my blog.
This blog post will focus on the statistics I gleaned from accessing the API for Blogger, which is a product of Google. If you are interested in more technical details, I'll point you to my Github repo where I share the code I used to get the results I present below. Rather than focus on visitors or visibility, I instead focus on production. That is, how often do I post? What is the typical length of my posts? What words do I tend to use? And so forth.
This is a relatively long post with some graphs and lots of discussion. Read on if you're interested in how this blog has evolved through time or if you want to learn how to do it yourself.
The First Steps
So before I could even get started, I needed to grab the full text of every post I had ever done. A long time ago I had created a word cloud from the first year of my blog, but I had done that because I could easily grab every post manually. Now that I have 172 posts to date, that becomes more tedious so I needed an automated way to do that. Enter the Google API.
With Google's API service you can query a variety of their products and directly get the information you want. You can set yourself up fairly easily using the Google Developer Console, enabling the API you are interested in (Blogger, in my case), and then set credentials with an OAuth 2.0 client ID. For that last step, I had to make sure to select "Other" as my client type as I ran my R code on my machine rather through a website or mobile application. Once that's all done, you're ready to write some code to access the API. As I mentioned earlier, you can see how I do this on my github repo (see anon_bloggerapi.R). There's actually a limit on how many posts you can grab from Blogger in a single request (20) so I had to loop through using the nextPageToken to grab all the posts.
The Data
So now that I had the data, I processed it a little bit to make it easier to work with. The data frame structure in R, and especially the dplyr package, make it very easy to work with this type of data. Some of the major things I did was to count the number of images (using the <img> html tag), eliminate HTML code, count the number of words (as delimited by spaces), and tally up the different labels I used. My code generates a variety of summaries I use here and also provides a dataset that I could pass to other scripts to generate some of the figures you'll see here.
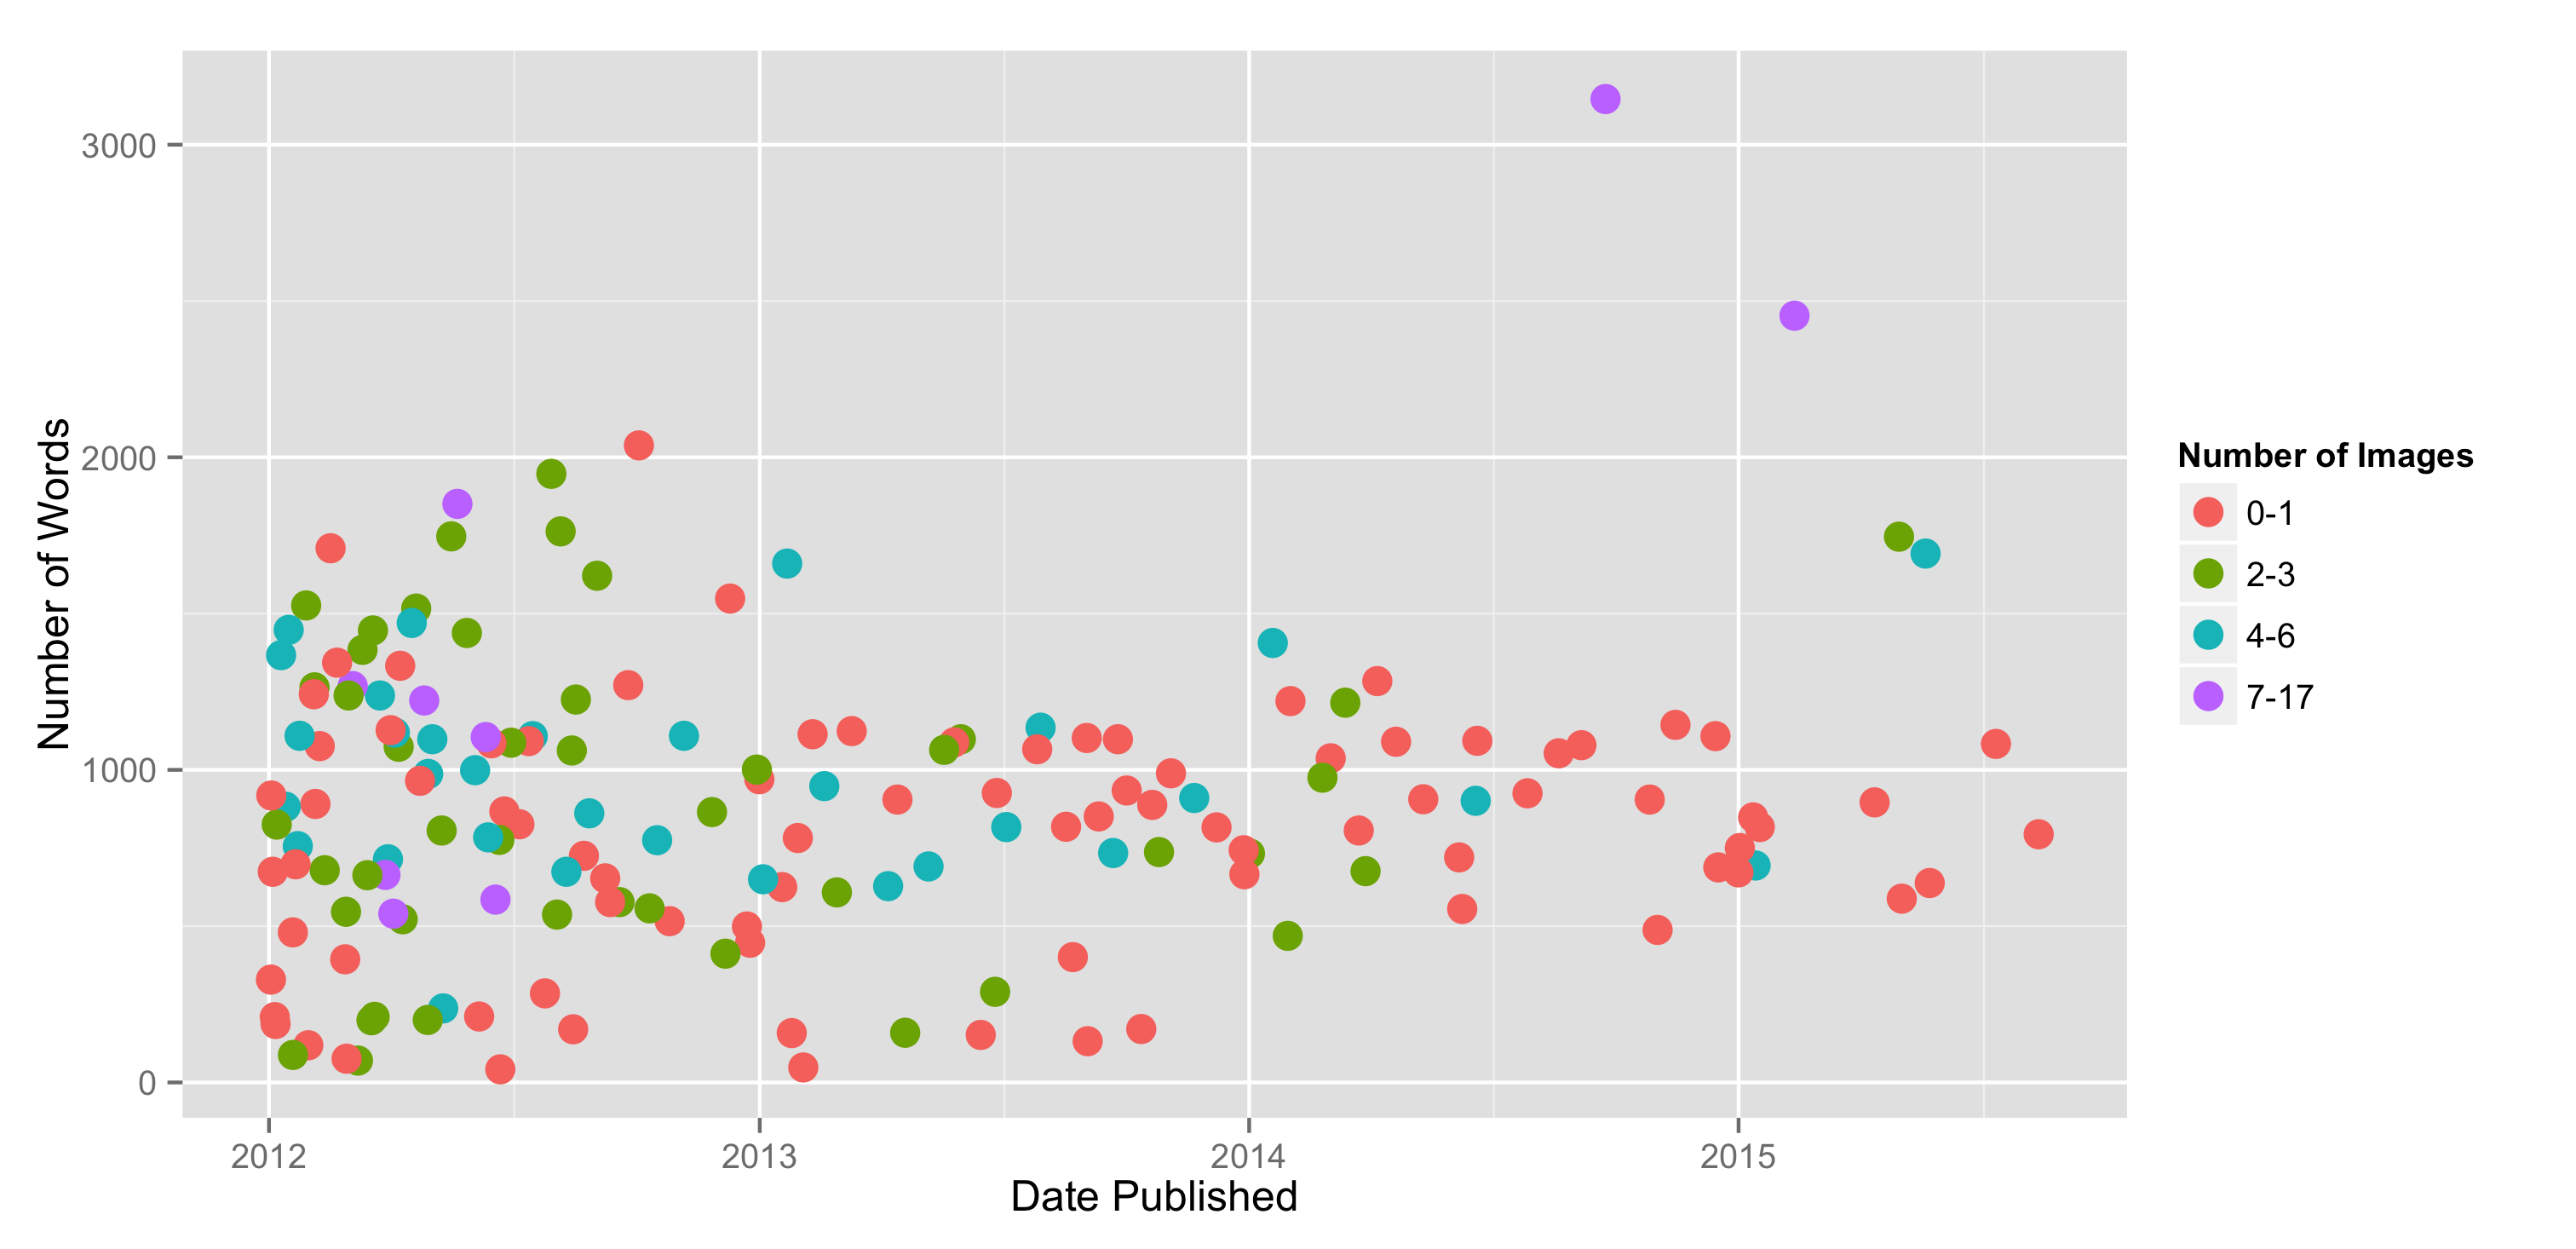
First up, some basic statistics regarding the length of my posts and how often I use figures. Most of the time I use only 1 figure, the cover of the book I'm reviewing. In fact, fully 50% of my posts have just one figure; 75% have less than 3, and 90% have less than 5. The largest number of images in a single post is 17, which is on my travelogue post on A Journey to Northern Patagonia. Second, at 14 images, is my similar post on A Journey to Southern Patagonia and Tierra de Fuego. Interesting, but not surprising, that my more image-heavy posts are about my travels in Chile.
A friend of mine would frequently complain how long my posts are. But that begs the question: exactly how long are my posts? And has this changed over time? Well, now I know. The average post length on my website is 892 words. The shortest has just 42 (Morning Mountains) and the longest 3146 (again, A Journey to Northern Patagonia). Over the years, my posts have generally stayed near the 1000 word mark. There are actually only three posts (the two travelogues above and A Year as a Postdoc Astronomer in Chile) that have more than 2000 words. The figure below shows this by plotting the length of my posts through time and color-coded by how many images are in the posts.
Frequency of Posts
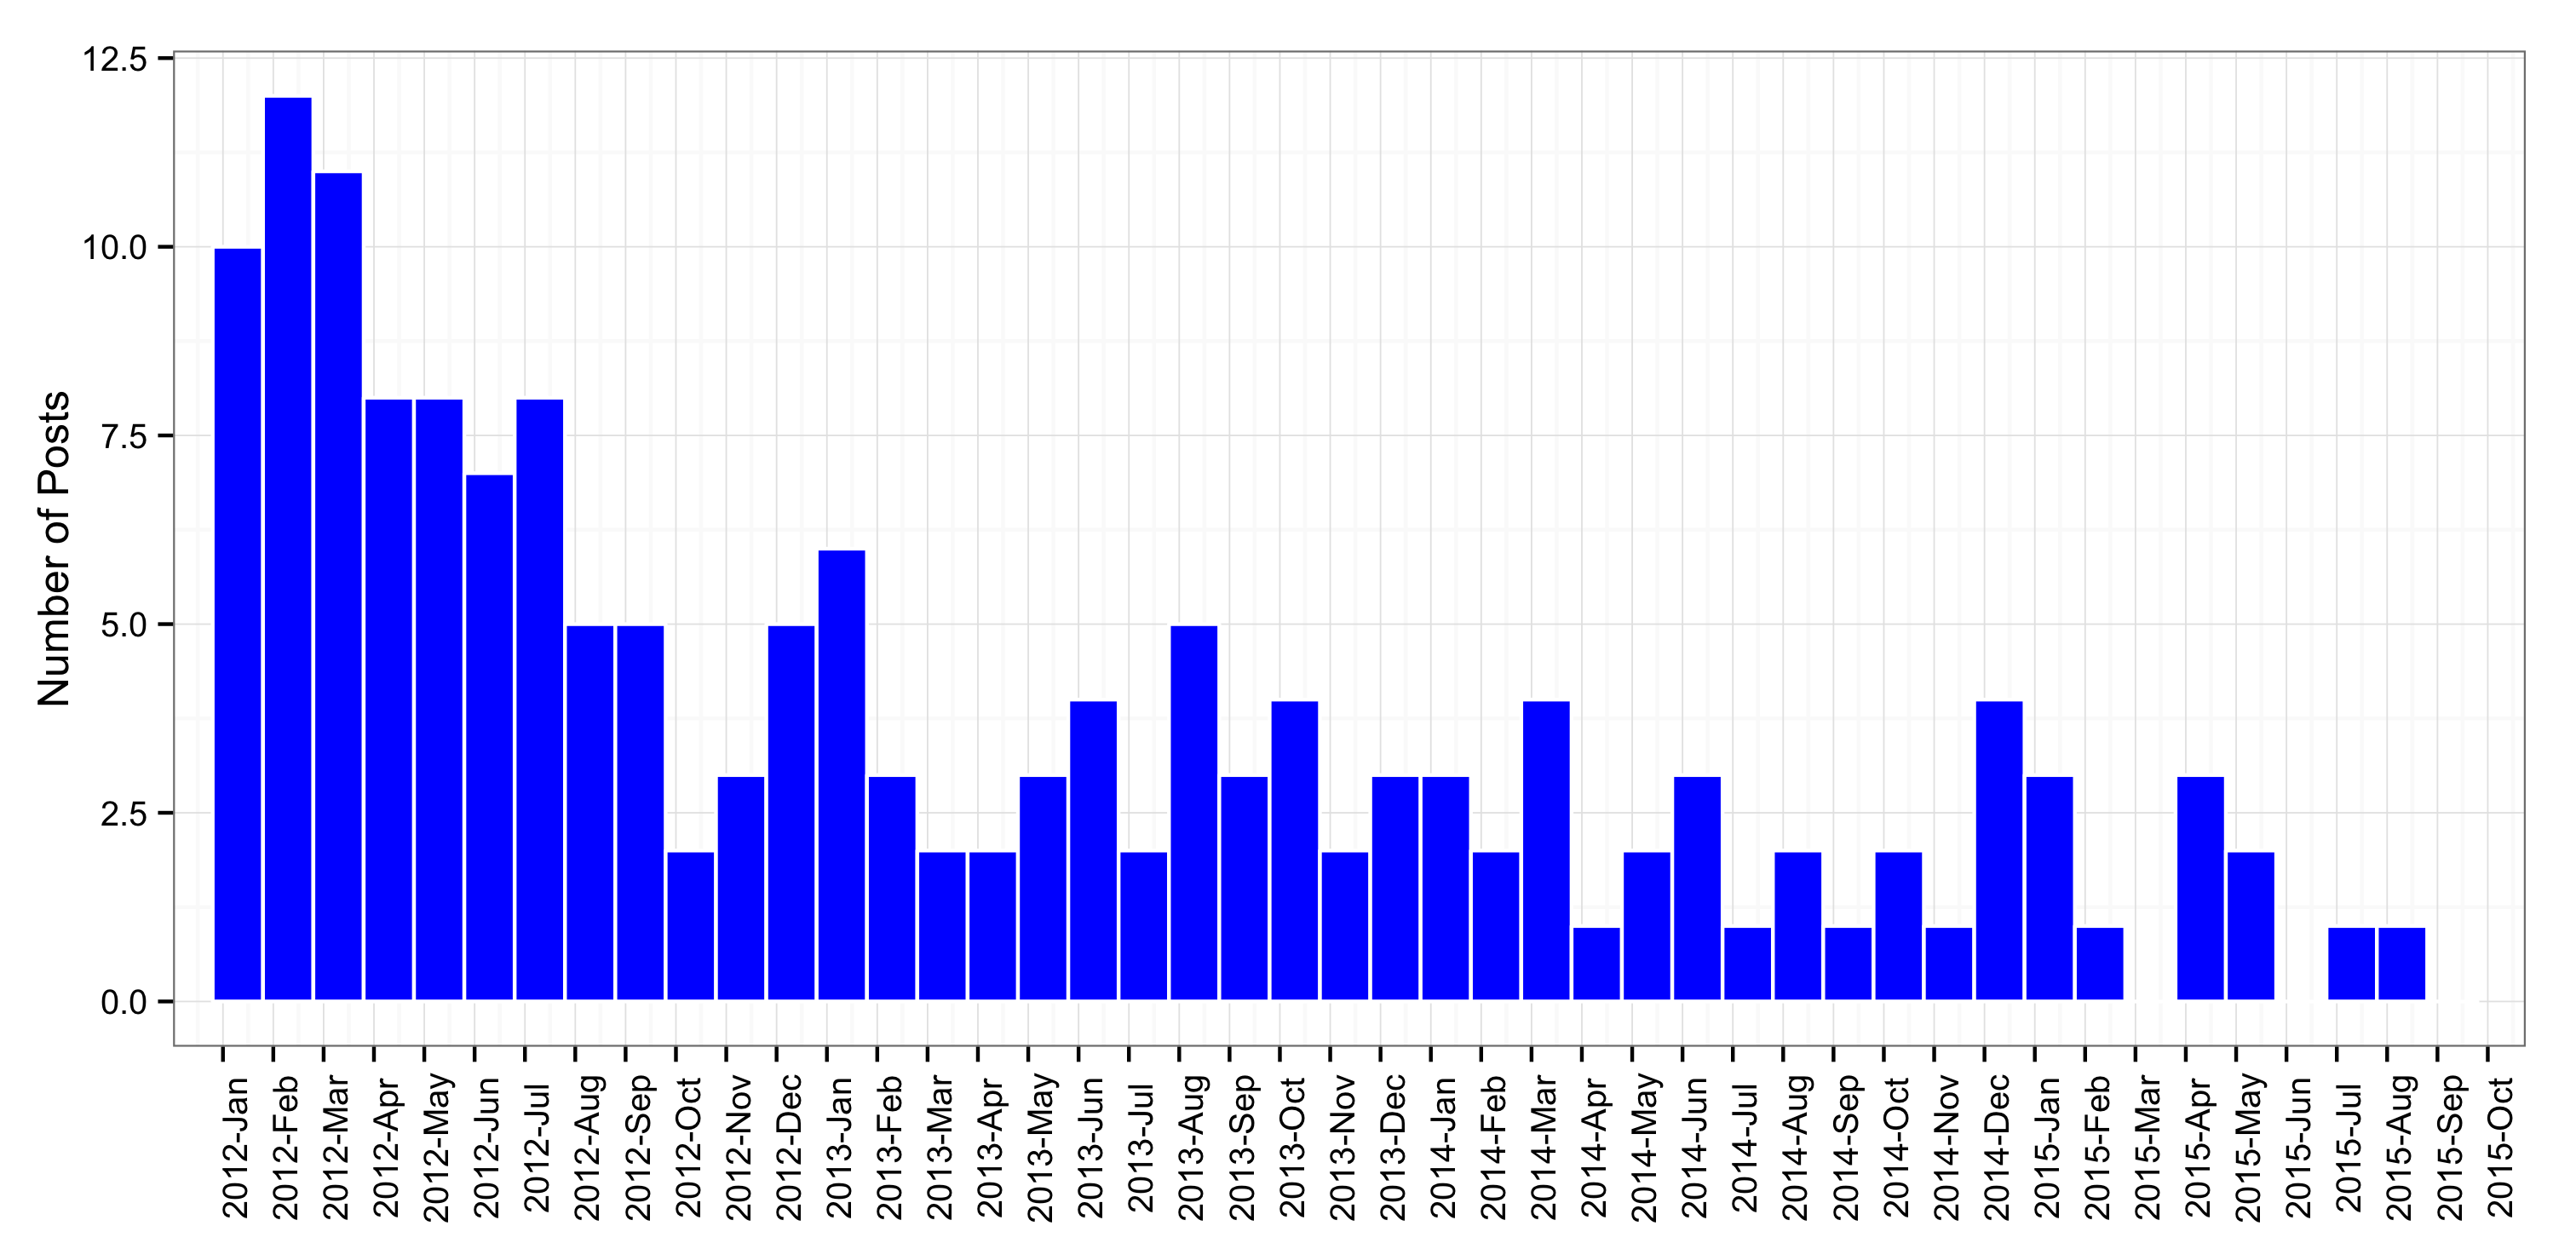
Probably one of the most obvious aspects of my blog is that the frequency of my posts has declined of late. The histogram below clearly illustrates this. The breaks in the histogram, however, are a bit misleading. These are every 30 days and not every month is that long. It was actually quite tricky to create a nice looking histogram based on dates. If I just look at the pure numbers I see that in January 2012 I had 16 posts, the largest number of posts in any given month since my blog was created (in January 2012). Following that is February, March, and April of 2012 with 11 posts each. Although the histogram isn't perfect, it still roughly shows the correct trend.
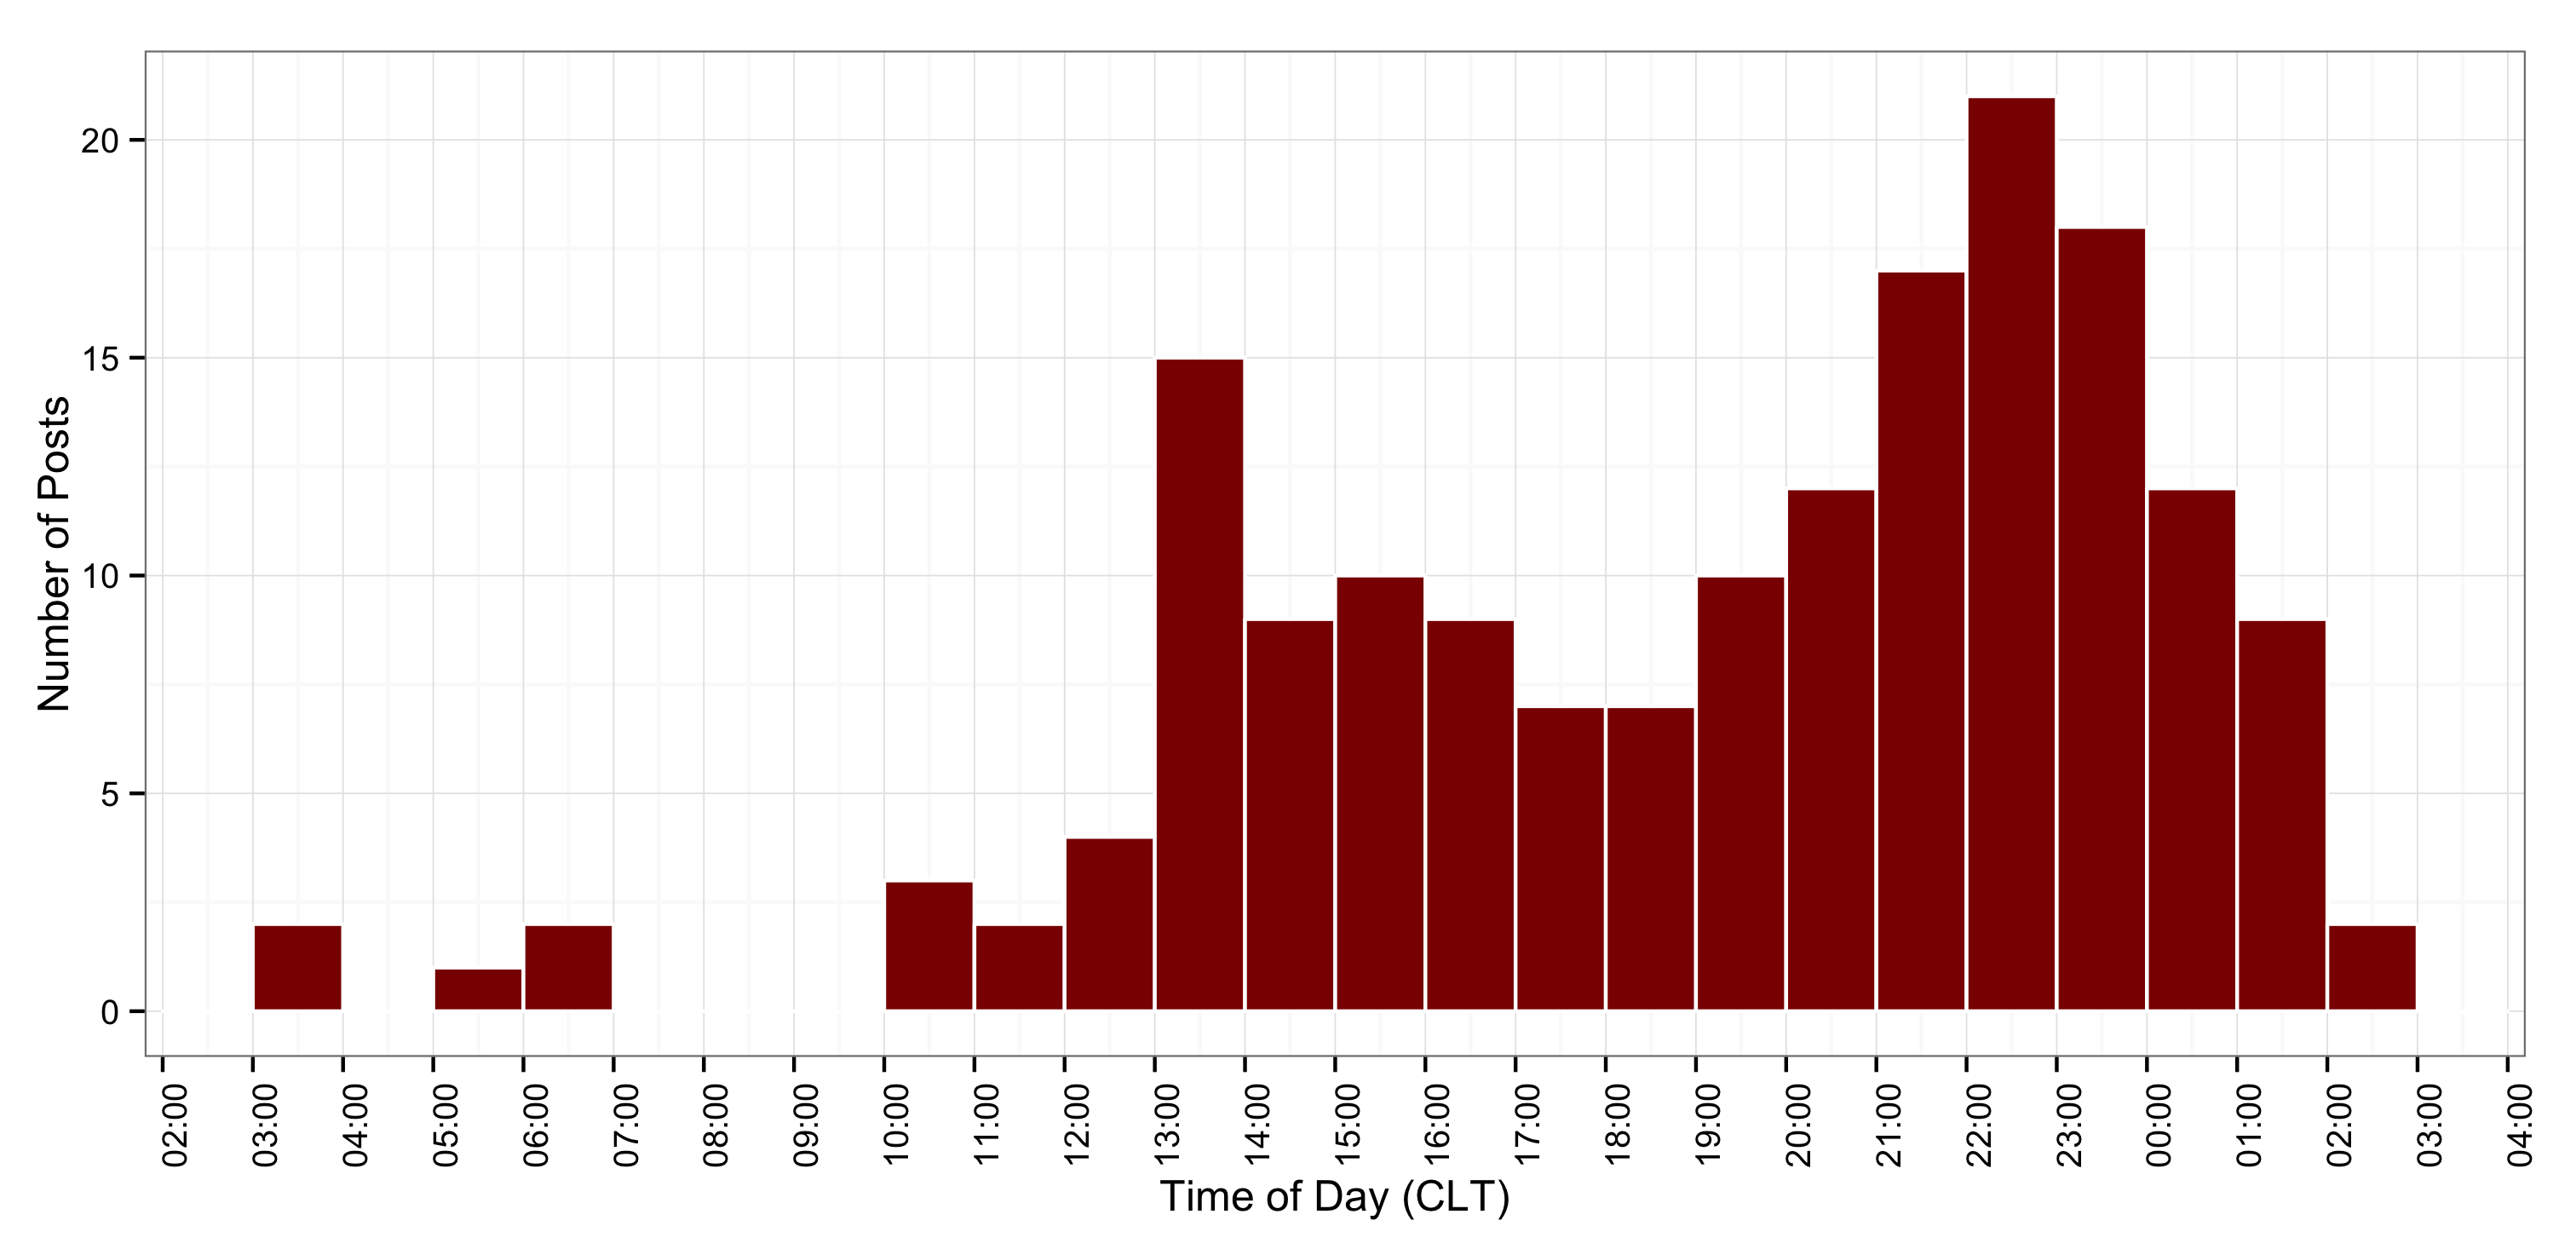
In a similar fashion, I can ask at what time of day I do I tend to post. Although the timezones tend to be tricky (Chile recently abolished daylight savings time), I can still get a good estimate as the API does return the exact time the blog posts have gone live. The histogram below shows how this. As you can see, most of my posts tend to be in the evening in Chilean time (CLT), though quite a few are in the early afternoon as well.
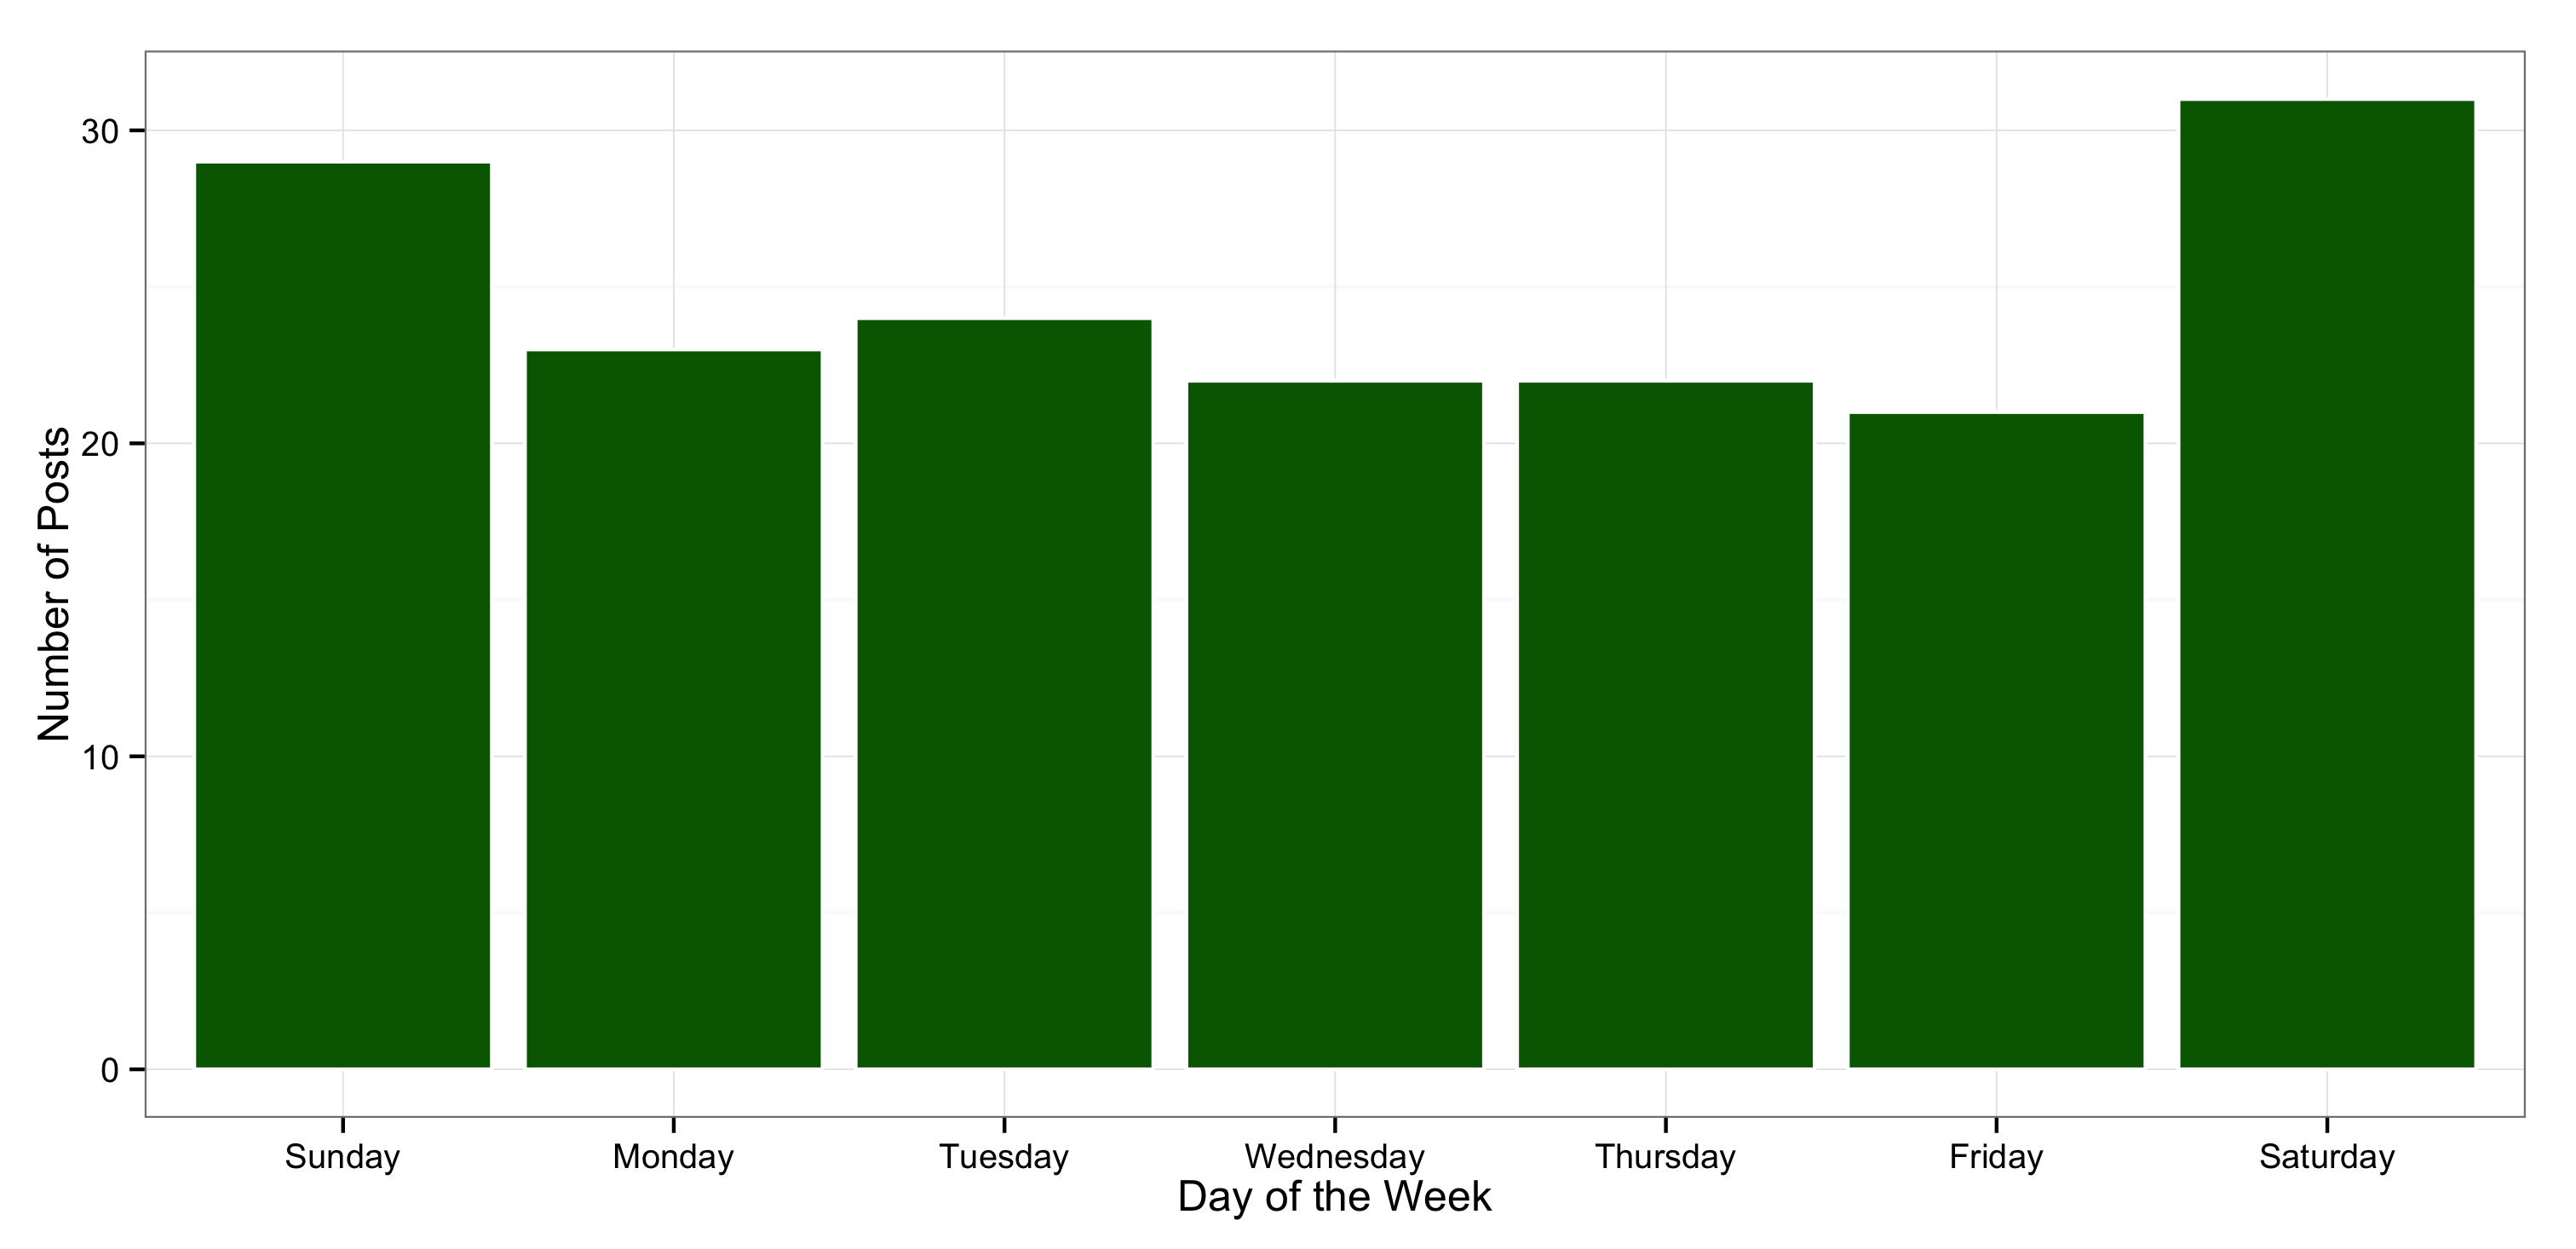
And finally, I can also examine what day of the week I posted using the weekdays() function in R. I tend to post more on the weekends, but otherwise the trend is fairly steady throughout the week. You can see this in the histogram below.
Type of Posts
A key question to ask yourself when visiting my blog is exactly what my blog is all about. My title is pretty generic, and I claim to talk about astronomy, books, and Chile, but how do my posts break down in these three broad labels? I created some snippets of code that would find that out exactly.
Overall, 83 of my posts are solely about books, though an additional 3 are about books and astronomy or books and Chile (so 86 total book posts). The second largest category is astronomy, with 60 posts labeled as such. Posts regarding Chile come in third with 27 posts. There are 19 posts not labeled as being related to astronomy, books, or Chile. If you add all these you wont come out to 172 posts because on many occasions, some posts are classified under multiple labels.
Seeing as books are the most common topic I write about, how do my posts breakdown in terms of science fiction, fantasy, or books from my book club? Fantasy books are the most common, at 45 posts, followed by science fiction at 24 posts. Since joining a book club here in Santiago, I have written 16 posts labeled under that category. Interestingly enough, there are 3 posts labeled as both Science Fiction and Fantasy; however, these are "summary" type posts where I talk about multiple books (for example, my Favorite Books of 2012).
Summary
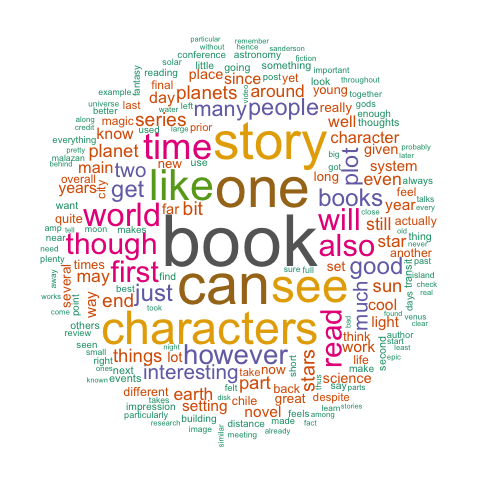
The final thing I did was to take all the text from the posts and generate a word cloud of them. I could have used a service like blogger, but I found some online resources about how to do that in R. In the end, I generated the 200-word cloud you can see at the very top of this post. It's easy to see that lots of book-related words are common in my posts.
Overall, this was a very fun and instructive experience. I'll probably do similar analyses in the future as my blog evolves and also perhaps using other resources, such as the Twitter API.
No comments:
Post a Comment
Note: Only a member of this blog may post a comment.